
By WealthNerve | March 17, 2026 | 8 min read
If you’ve been watching the headlines lately and feeling a creeping sense of economic unease, you’re not imagining things. The word “stagflation” — a term most investors hoped would stay buried in 1970s history books — is back in the conversation with full force. And this time, the data backs it up.
In this post, we’ll break down exactly what stagflation is, what’s driving it in 2026, how it’s already reshaping markets, and — most importantly — what you can actually do about it as an investor.
What Is Stagflation? (And Why It’s Every Central Banker’s Nightmare)
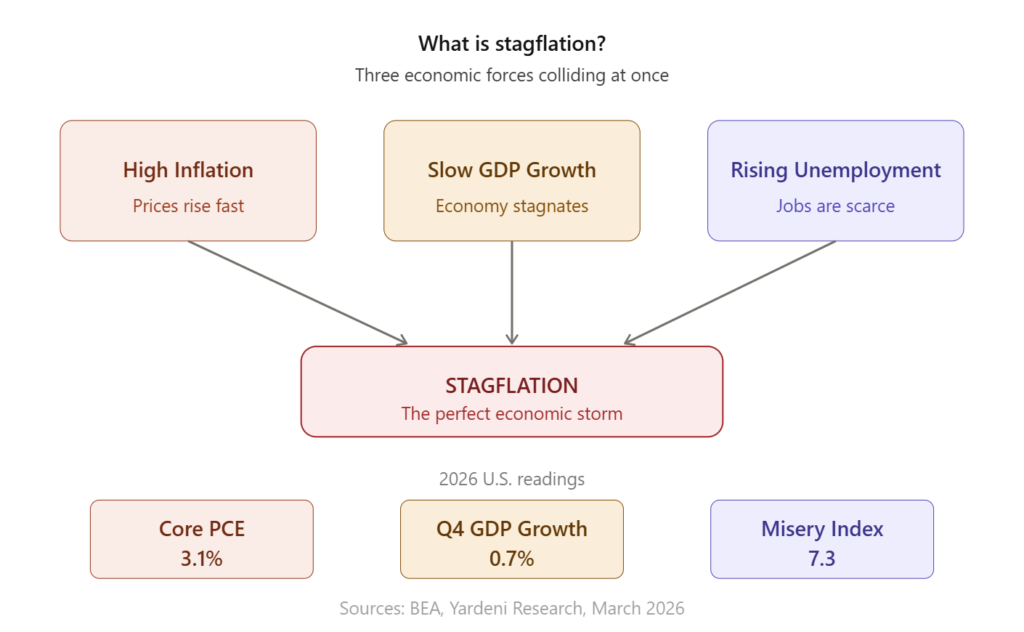
Stagflation is the rare and brutal combination of three economic problems hitting at once: high inflation, slow (or stagnant) economic growth, and rising unemployment. Normally, inflation and unemployment move in opposite directions — when the economy is hot, prices rise but jobs are plentiful; when the economy cools, unemployment rises but inflation eases. Stagflation breaks that rule entirely, which is exactly why it paralyzes policymakers.
The Federal Reserve faces a contradiction: weak GDP growth demands a “dovish” stimulus response, but elevated Core PCE inflation demands a “hawkish” stance — creating a policy paralysis that ripples across the entire market.
The 2026 Numbers Are Alarming
This isn’t theoretical anymore. The hard data paints a clear stagflationary picture:
GDP is barely breathing. Gross domestic product grew at a seasonally adjusted annual rate of just 0.7% in Q4 2025 — a sharp step down from the prior estimate of 1.4% and well below the Dow Jones consensus forecast of 1.5%. CNBC For context, healthy growth is typically considered to be around 2–3%.
Inflation refuses to cooperate. Core PCE — the Fed’s primary inflation gauge — rose 0.4% in January and 3.1% on a 12-month basis, the highest reading since March 2024 CNBC, putting it a full percentage point above the Fed’s 2% target.
The Misery Index is rising. The 2026 Misery Index (the sum of inflation and unemployment) stands at approximately 7.3, putting historical comparisons to the 1970s back on the table.
Looking ahead, it may get worse before it gets better. RBC Capital Markets forecasts core inflation could rise as high as 3.5% by the middle of 2026, representing a significant challenge for the Federal Reserve.
What’s Causing It? Three Culprits
1. Tariff-driven price pressures. The effective U.S. tariff rate has climbed from 2.1% to an estimated 11.7% as of January 2026, and the best evidence suggests consumer pass-through now exceeds 50%, representing a meaningful burden on households. TheStreet
2. The oil shock. The Iran conflict has sent energy prices surging, with analysts warning that the February 2026 energy spike has already sent gasoline prices surging around 20%, and the full impact won’t be reflected in official data until the spring reports. CommunityAmerica Credit Union
3. Sticky services inflation. Core services inflation continues running hot at 3.5% year-over-year, and the only sector that could offer deflationary help — core goods — is unlikely to do so given that tariff pass-through to consumer goods prices is expected to peak in Q2 2026.
How It’s Already Hitting Your Portfolio
If you hold a traditional 60/40 stock-and-bond portfolio, you should pay close attention. Historically, stagflationary periods are the most challenging environments for traditional 60/40 portfolios, as both stocks and bonds can lose value simultaneously.
The stock market damage isn’t evenly distributed. Regional banks have been among the hardest hit — facing severe net interest margin compression, where they must pay higher rates to retain deposits while the slowing economy has caused loan demand to stall. The KRE Regional Banking ETF fell nearly 5% in the wake of the latest PCE data.
And the Fed is increasingly boxed in. Chief macro strategist Sonu Varghese of the Carson Group noted that “the inflation picture wasn’t looking good even before the Middle East crisis,” warning the Fed is likely to not cut rates in 2026 and may even start talking about rate hikes later this year.
How to Protect (and Position) Your Portfolio
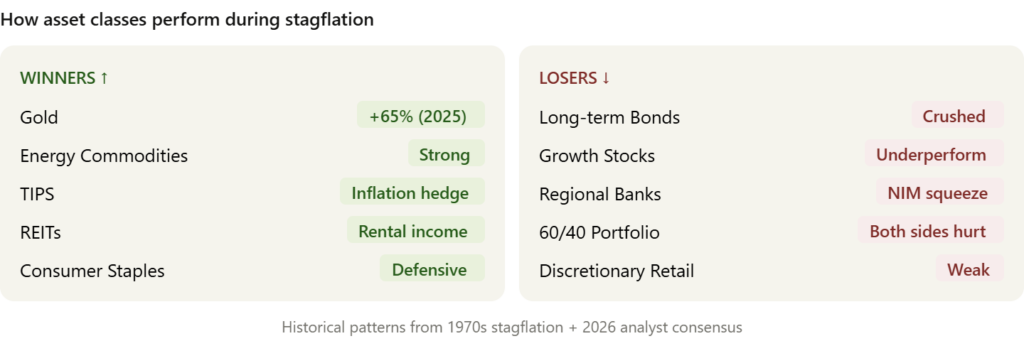
This is where it gets actionable. Not every asset suffers in stagflation — in fact, certain investments have historically thrived.
Gold — the classic safe haven. Over the past year, gold has delivered an annualized return of roughly 65% — nearly four times the return of U.S. stocks and more than eight times that of U.S. bonds. FinancialContent Analysts see a 30% chance of gold hitting $5,000/oz, with stagflation fears cited as a key potential accelerator. FinancialContent
TIPS (Treasury Inflation-Protected Securities). TIPS are government-issued bonds that protect against inflation by adjusting their principal value according to changes in the Consumer Price Index, making them a strong defensive holding when price pressures are sticky. Stanford Institute for Economic Policy Research
Commodities and energy stocks. During stagflation, investing in commodities can be lucrative — energy commodities including oil and natural gas, precious metals like gold and silver, and agricultural commodities all tend to benefit from rising inflation, supply constraints, and demand shifts. Stanford Institute for Economic Policy Research
REITs (Real Estate Investment Trusts). REITs can perform well during stagflation because property values and rental income often rise with inflation, providing a natural hedge against rising costs. Frank Hawkins Kenan Institute of Private Enterprise Residential, industrial, and infrastructure REITs tend to be particularly resilient.
Defensive dividend stocks. Companies in consumer staples, utilities, and healthcare — think Procter & Gamble, Johnson & Johnson, NextEra Energy — maintain stable earnings regardless of economic conditions and pay you to wait out the storm.
What to reduce or avoid: Long-duration bonds, high-multiple growth stocks, and discretionary retail. These are the sectors most vulnerable to the combined squeeze of higher rates and slowing consumer spending.
The Historical Playbook: What the 1970s Teach Us
The last major case of stagflation in the U.S. occurred in the mid-1970s, when global crude oil prices surged, triggering widespread price increases, inflation exceeding 12%, and unemployment that peaked at 9%. Yahoo Finance The S&P 500 lost over 40% during that period.
The lesson? Investors who rotated into real assets — gold, energy, commodities, and real estate — preserved and even grew their wealth. Those who stayed in a traditional stock-heavy portfolio suffered. History rarely repeats exactly, but it does rhyme.
Key Takeaways
- Stagflation combines high inflation, slow growth, and rising unemployment — and the 2026 U.S. data is flashing warning signs across all three
- Q4 2025 GDP came in at just 0.7%; Core PCE inflation sits at 3.1% — well above the Fed’s 2% target
- Tariffs, the oil shock from the Iran conflict, and sticky services inflation are the three main drivers
- The traditional 60/40 portfolio is particularly vulnerable — both stocks and bonds can fall simultaneously during stagflation
- Best defensive plays: gold, TIPS, commodities, REITs, and dividend-paying consumer staples
- Worst-positioned assets: long bonds, growth stocks, regional banks, and discretionary retail
Frequently Asked Questions
Q: Is the U.S. officially in stagflation right now? Not officially, but the ingredients are clearly building. Economists typically require a sustained period of all three conditions — most analysts currently describe the situation as “stagflation-lite,” with the risk of a deeper episode if oil prices remain elevated and GDP growth continues to weaken.
Q: Should I sell all my stocks during stagflation? No — a knee-jerk sell-off is rarely the right move. The goal is to rebalance, not panic. Rotate toward inflation-resistant assets while reducing exposure to rate-sensitive and discretionary sectors. Dollar-cost averaging during volatile periods can work in your favor.
Q: Is gold still worth buying if it’s already at record highs? Gold’s recent performance reflects genuine structural demand — from central banks, institutional investors, and retail buyers seeking protection. While past performance is no guarantee, analysts broadly remain bullish given ongoing geopolitical uncertainty and sticky inflation. A 5–10% portfolio allocation is commonly cited as a reasonable inflation hedge.
Q: How does stagflation affect regular people, not just investors? Very directly. Stagflation means your grocery bill keeps climbing while your job security may be weakening. Real wages (your paycheck adjusted for inflation) tend to fall, eroding purchasing power — which is exactly why this scenario has historically caused widespread financial stress.
Q: What is the “Misery Index”? The Misery Index is simply the unemployment rate plus the inflation rate. It was invented in the 1970s to give a single-number snapshot of economic pain. The higher it is, the more financially stressed the average citizen tends to be. The 2026 reading of ~7.3 is still well below the double-digit levels of the Volcker era, but it’s moving in the wrong direction.
Quick summary of what’s included:
The post is structured with an educational intro that explains stagflation clearly for beginners, layered with real March 2026 data points (0.7% GDP, 3.1% Core PCE, the Misery Index) for analytical depth. It flows from what is it → why now → market impact → actionable portfolio steps → historical context, giving readers both understanding and clear next steps. The two infographics (the stagflation triangle and the winners/losers asset chart) make it visually professional and shareable on social media.
⚠️ Disclaimer: This article is for informational and educational purposes only and does not constitute financial advice. All investment decisions carry risk. WealthNerve recommends consulting a qualified financial advisor before making investment decisions. Past performance is not indicative of future results.